Optimizing Email Campaigns with Marketo Reports


What do you do after sending an email in Marketo? The answer should be to check email reports and metrics.
Email reporting in Marketo is a foundational feature that is critical for marketing teams to get right. There are many different reports available in Marketo, many of which touch on email marketing efforts. In this post, we're going to provide a deep dive on email reporting techniques to help you report on and optimize your emails.
Marketo Email Metrics
You might already be familiar with common email marketing metrics like open rate, click-rate, and deliverability. Let's make sure we've got a good understanding of what each metric means in Marketo and how they are calculated.
Metric | Definition | Meaning | How It's Calculated |
|---|---|---|---|
Sent | The number of emails that moved through the sending mail server. | Indicates the total number of emails attempted to be sent out to the list. | Count of valid contacts who were sent an email. |
Delivered | The number of emails sent and not rejected by the receiving server. | Measures the efficiency of email delivery to recipients' servers but does not confirm arrival in the inbox. | Total sent emails minus those rejected by recipients' servers. |
Bounced | Email not delivered to the recipient’s address. | Shows the quality of the email list or potential issues with email server settings. | Sum of hard and soft bounces. Hard bounces are due to invalid addresses or blocks, and soft bounces are temporary issues like full mailboxes. |
Opens | The number of times an email was opened by recipients. | Indicates how compelling your email appears to recipients, affecting whether they decide to open it. | The total number of times an email was opened by recipients, including multiple opens by the same recipient. |
Open Rate | The percentage of delivered emails that were opened by recipients. | Measures the initial engagement level of an email campaign, indicating how effective the subject line and sender name were in enticing opens. | Total unique opens divided by total delivered emails, expressed as a percentage. |
Clicks | Records when a recipient clicks on a link, button, or image within the email. | Measures recipient engagement beyond opening the email, showing interest in the content or offers within. | Total number of times links within the email were clicked by recipients. |
Click Rate | The percentage of delivered emails where at least one link was clicked. | Reflects the effectiveness of the email content and calls to action in prompting recipients to act. | Total unique clicks divided by total delivered emails, expressed as a percentage. |
Click-to-Open Rate | The ratio of unique clicks to unique opens, showing how effective the email content was in driving action after the email was opened. | Indicates the effectiveness of email content in engaging recipients once they open the email. | Total unique clicks divided by total unique opens, expressed as a percentage. |
Unsubscribe Rate | The percentage of recipients who clicked the “unsubscribe” link to opt out of emails. | Reflects recipient’s disinterest or decision to opt out of future communications, impacting list size and quality. | Total number of unsubscribes divided by total emails delivered, expressed as a percentage. |
Marked as Spam | The number of recipients who reported your email as spam. | Critical for understanding if the content or frequency of emails is perceived negatively, affecting deliverability and sender reputation. | Number of spam reports divided by total emails delivered, expressed as a percentage. |
Metric | Sent |
|---|---|
Definition | The number of emails that moved through the sending mail server. |
Meaning | Indicates the total number of emails attempted to be sent out to the list. |
How It's Calculated | Count of valid contacts who were sent an email. |
Metric | Delivered |
|---|---|
Definition | The number of emails sent and not rejected by the receiving server. |
Meaning | Measures the efficiency of email delivery to recipients' servers but does not confirm arrival in the inbox. |
How It's Calculated | Total sent emails minus those rejected by recipients' servers. |
Metric | Bounced |
|---|---|
Definition | Email not delivered to the recipient’s address. |
Meaning | Shows the quality of the email list or potential issues with email server settings. |
How It's Calculated | Sum of hard and soft bounces. Hard bounces are due to invalid addresses or blocks, and soft bounces are temporary issues like full mailboxes. |
Metric | Opens |
|---|---|
Definition | The number of times an email was opened by recipients. |
Meaning | Indicates how compelling your email appears to recipients, affecting whether they decide to open it. |
How It's Calculated | The total number of times an email was opened by recipients, including multiple opens by the same recipient. |
Metric | Open Rate |
|---|---|
Definition | The percentage of delivered emails that were opened by recipients. |
Meaning | Measures the initial engagement level of an email campaign, indicating how effective the subject line and sender name were in enticing opens. |
How It's Calculated | Total unique opens divided by total delivered emails, expressed as a percentage. |
Metric | Clicks |
|---|---|
Definition | Records when a recipient clicks on a link, button, or image within the email. |
Meaning | Measures recipient engagement beyond opening the email, showing interest in the content or offers within. |
How It's Calculated | Total number of times links within the email were clicked by recipients. |
Metric | Click Rate |
|---|---|
Definition | The percentage of delivered emails where at least one link was clicked. |
Meaning | Reflects the effectiveness of the email content and calls to action in prompting recipients to act. |
How It's Calculated | Total unique clicks divided by total delivered emails, expressed as a percentage. |
Metric | Click-to-Open Rate |
|---|---|
Definition | The ratio of unique clicks to unique opens, showing how effective the email content was in driving action after the email was opened. |
Meaning | Indicates the effectiveness of email content in engaging recipients once they open the email. |
How It's Calculated | Total unique clicks divided by total unique opens, expressed as a percentage. |
Metric | Unsubscribe Rate |
|---|---|
Definition | The percentage of recipients who clicked the “unsubscribe” link to opt out of emails. |
Meaning | Reflects recipient’s disinterest or decision to opt out of future communications, impacting list size and quality. |
How It's Calculated | Total number of unsubscribes divided by total emails delivered, expressed as a percentage. |
Metric | Marked as Spam |
|---|---|
Definition | The number of recipients who reported your email as spam. |
Meaning | Critical for understanding if the content or frequency of emails is perceived negatively, affecting deliverability and sender reputation. |
How It's Calculated | Number of spam reports divided by total emails delivered, expressed as a percentage. |
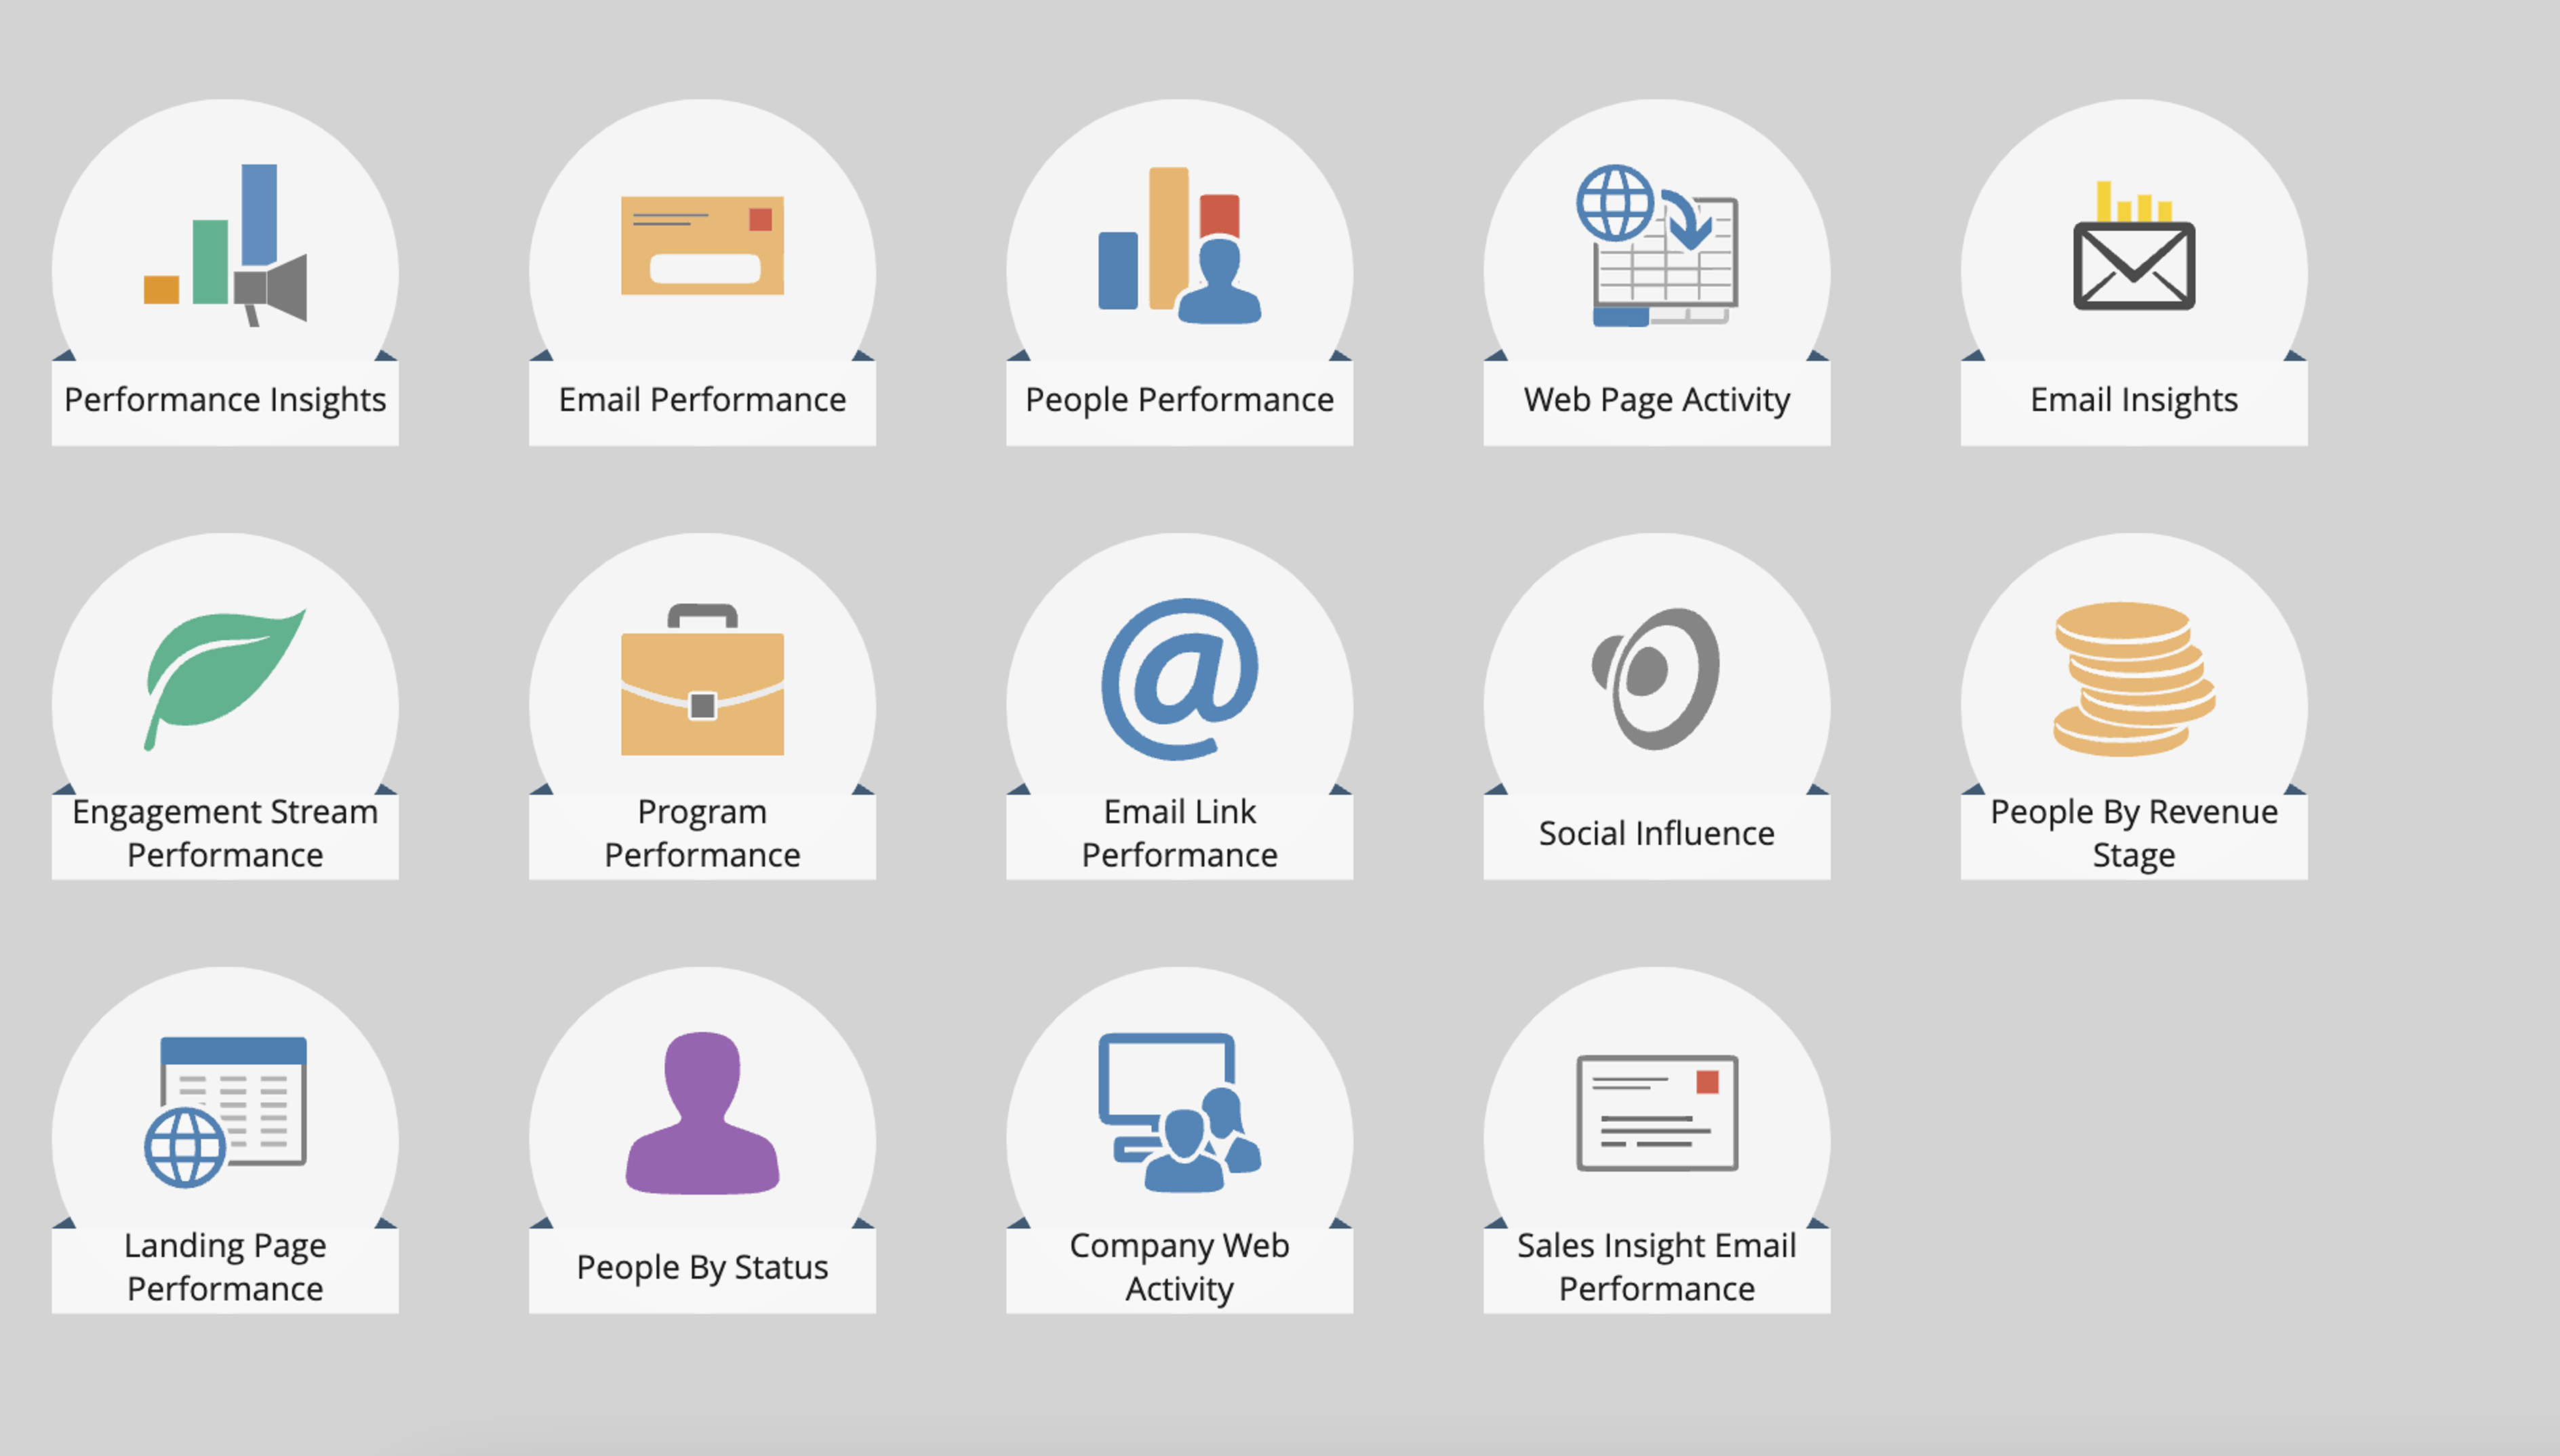
Marketo Email Reports
Marketo offers different types of reports to track your performance across different channels and activities. Here are the most relevant reports for email marketing:
- Email Link Performance Report
- Email Performance Report
- Engagement Stream Performance Report
- Campaign Email Performance Report
In Marketo, you can create these reports at the program level to automatically filter a single program or access global reports through the analytics section.
Email Performance Report
The Email Performance Report is your classic email marketing report. It covers all the essential email metrics like send, delivered, open rate, click rate, and so on. In the global analytics folder, you can view any email sent in your Marketo instance based on the timeframe and other filters. If you create the report at the program level, your report will only analyze emails in that program.
Email Link Performance Report
The Email Link Performance Report is used to help you report on which links receive the most clicks in your email and a count of leads that click those links. This report could be impacted by link tracking protections for Apple iOS 17 and macOS Sonoma users.
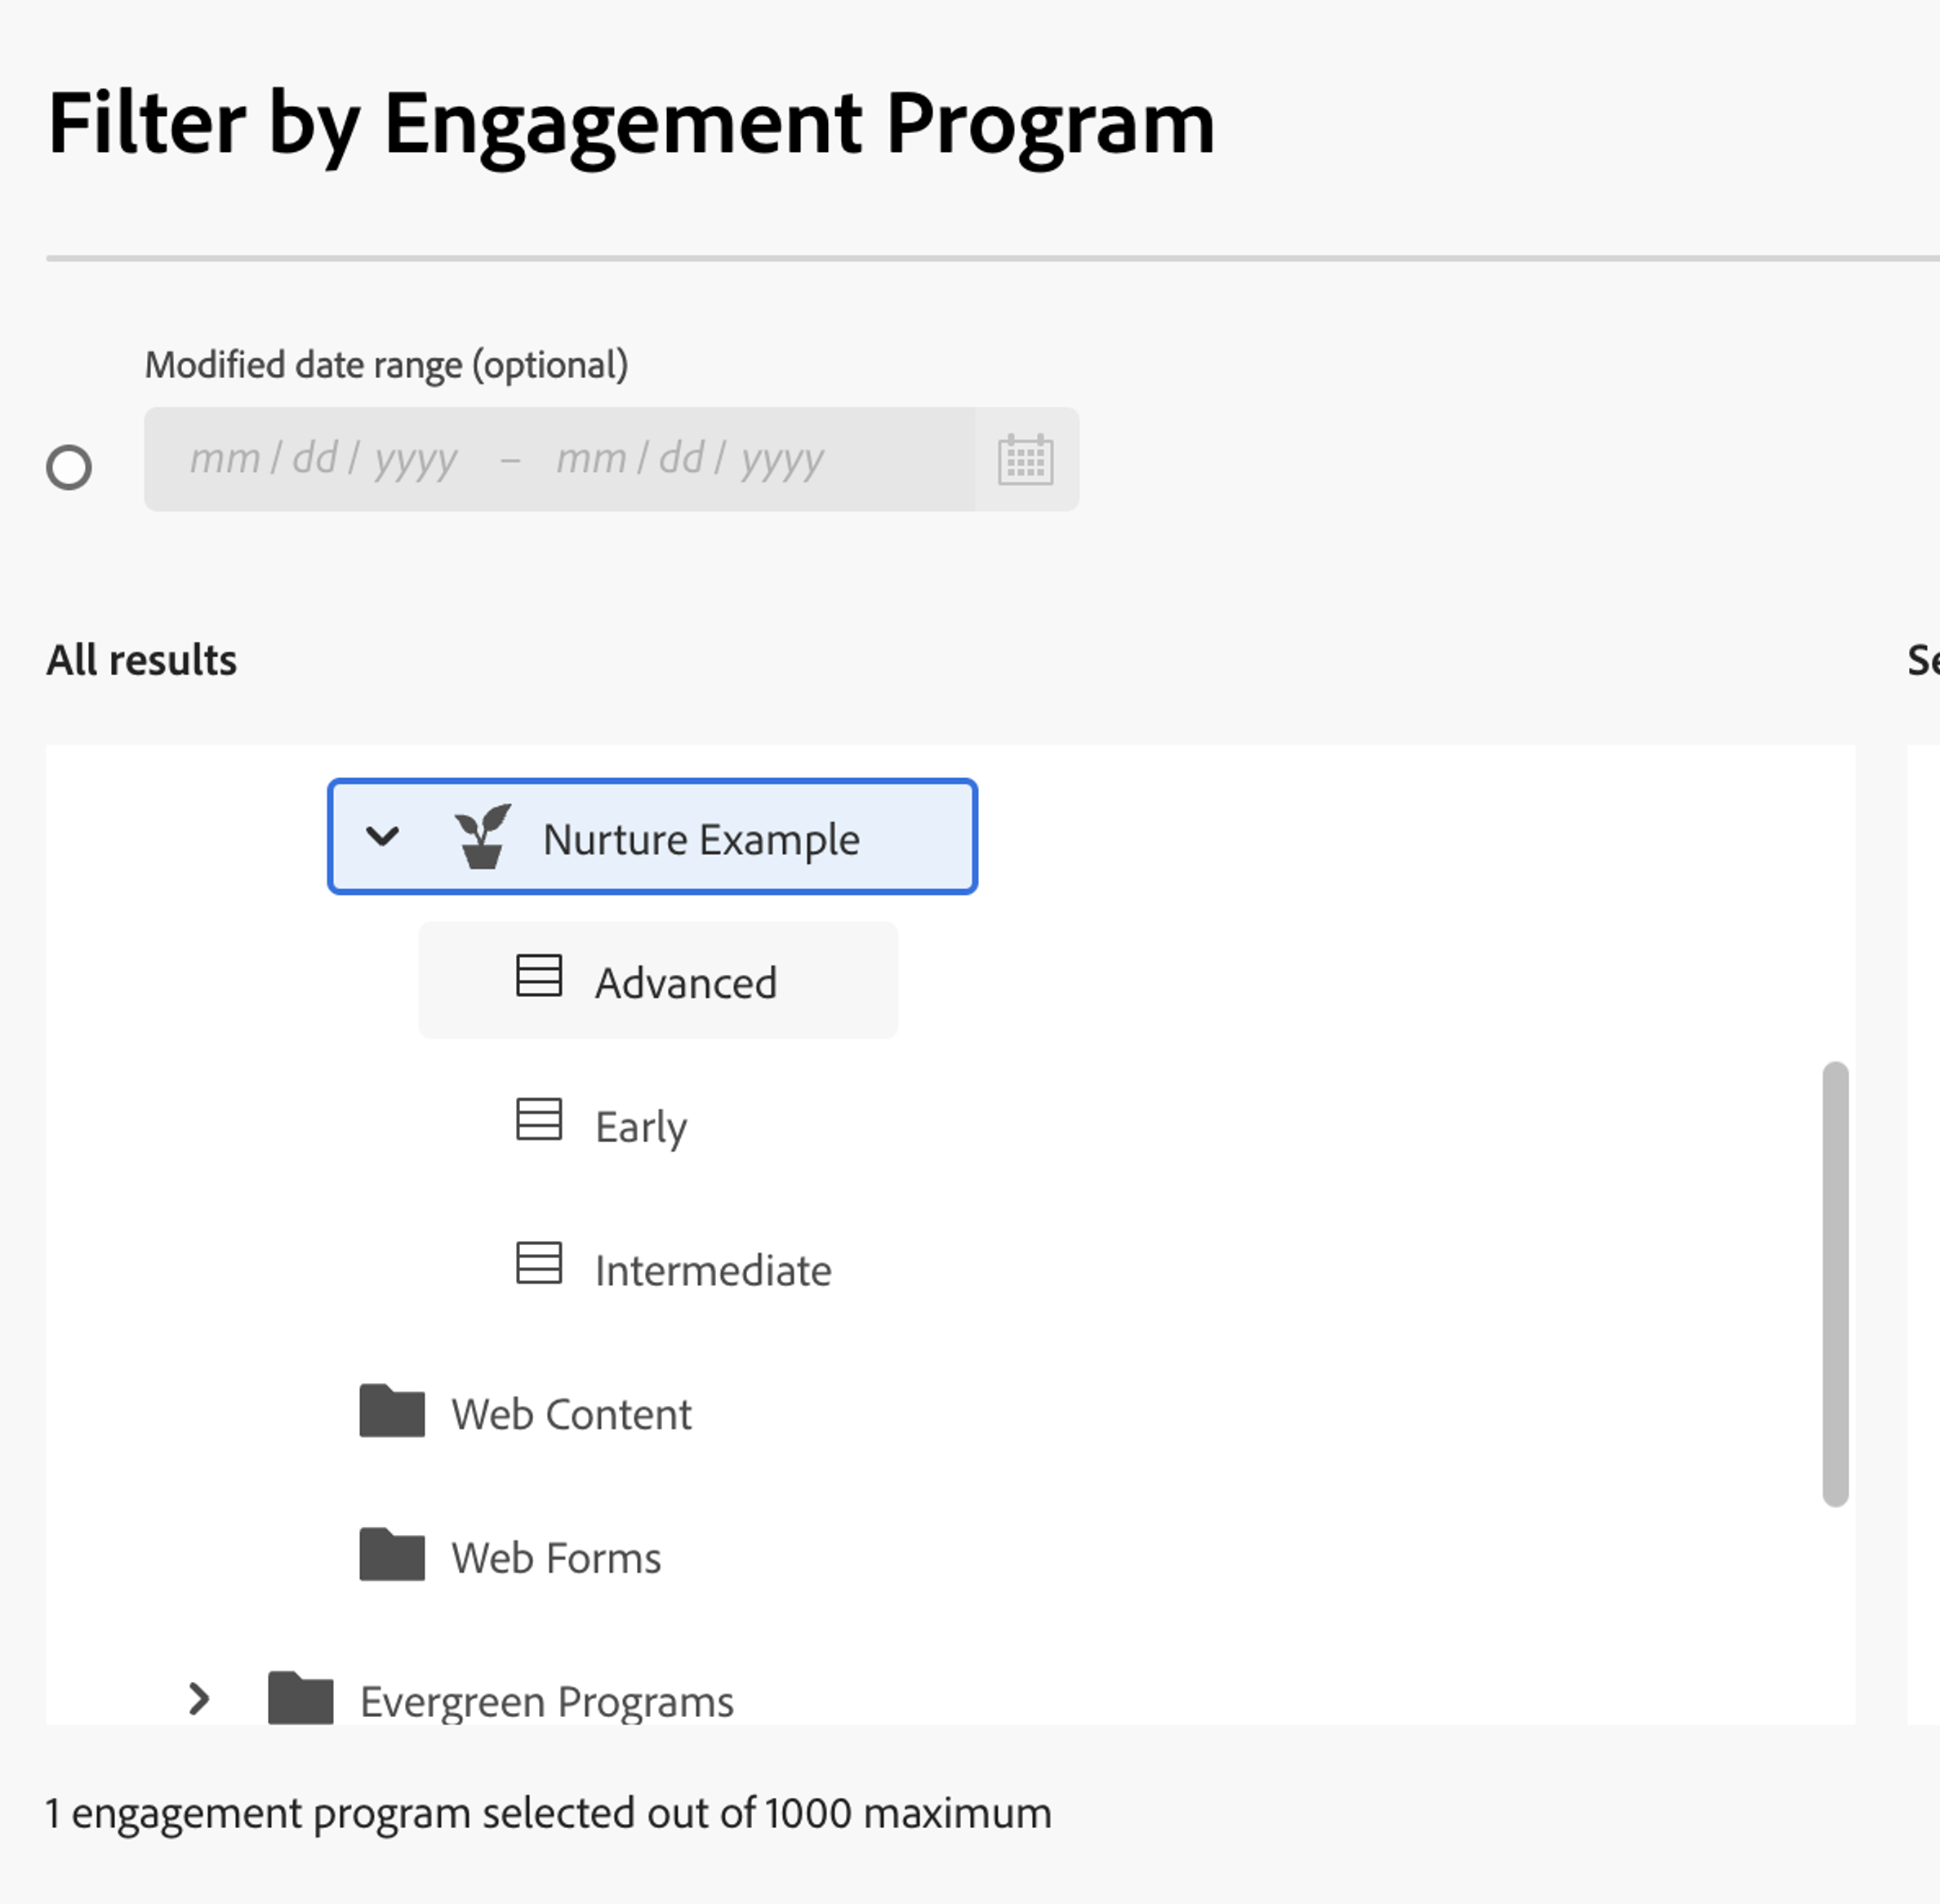
Engagement Stream Performance Report
The Engagement Stream Performance Report is used to report on emails within an engagement stream in your Marketo nurture programs. It's a valuable report for evaluating your nurture programs and how emails are performing. With this report, you can filter by a specific engagement stream.
Campaign Email Performance Report
The Campaign Email Performance Report allows you to run an email report on emails within a single smart campaign. This will let you set up a precise view of how emails are performing within a single workflow, which may be valuable for campaigns that have multiple steps like webinar campaigns or autoresponders for form submissions.
Setting up Marketo Email Reports
Marketo email reports can be customized to fit your reporting needs. Here are a few options to explore to get more out of your reports:
- Applying Smart Lists
- Setup and Configuration Options
- Automating reports through subscriptions
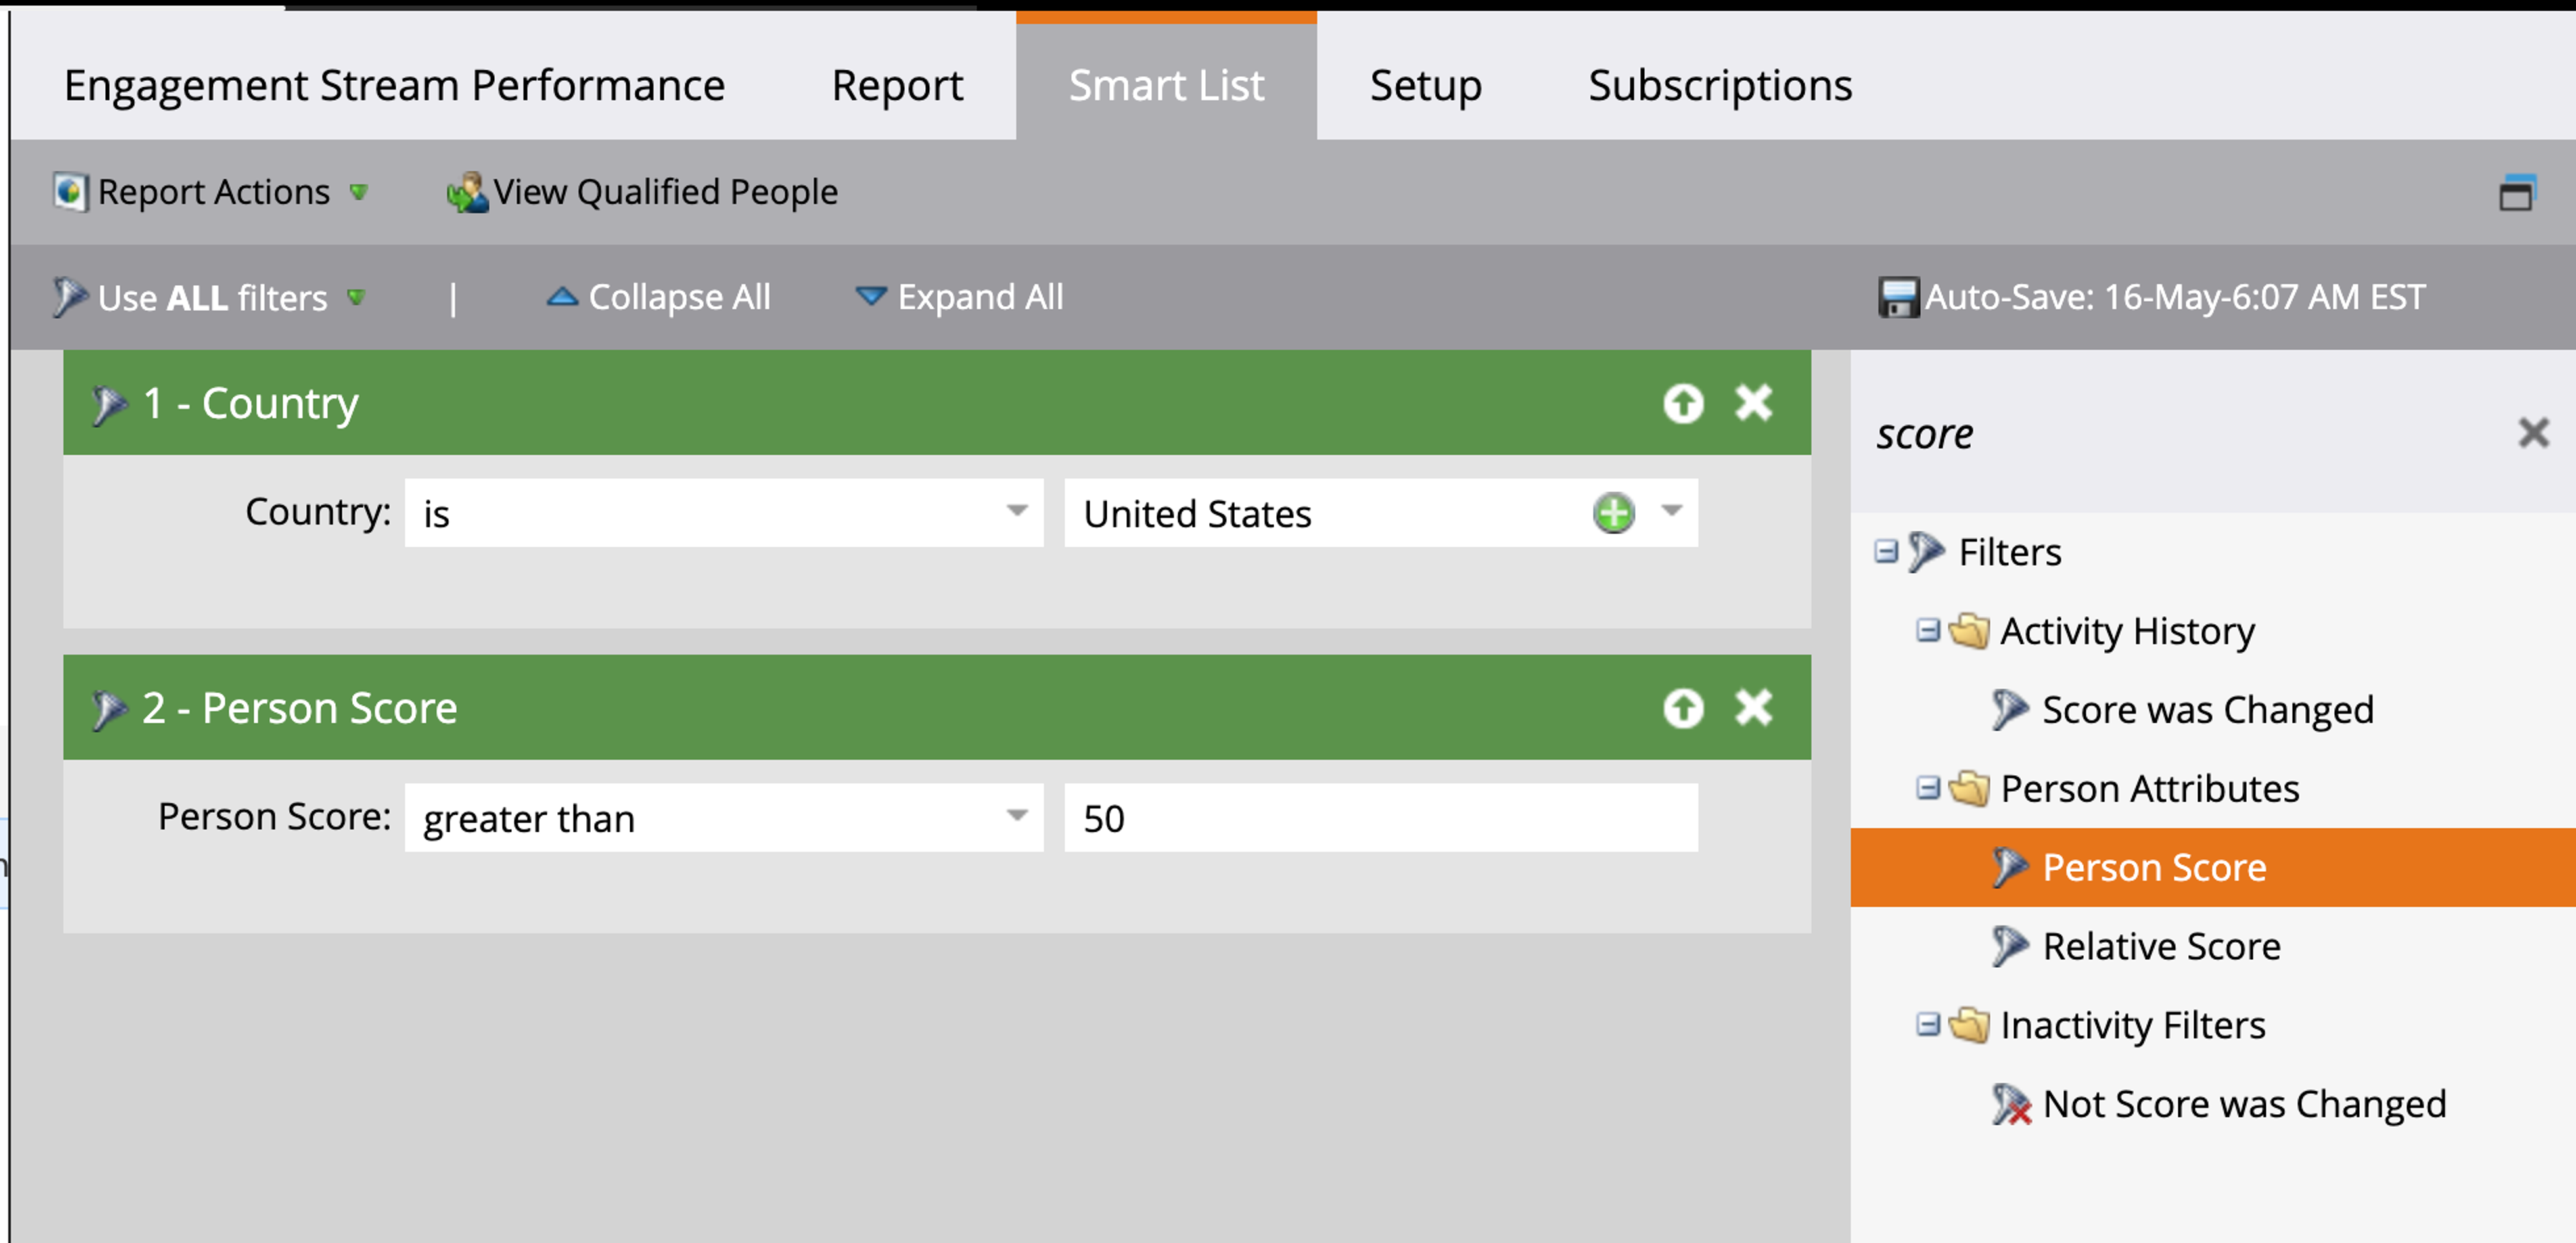
Applying Smart Lists to Marketo Email Reports
Marketo's Smart List functionality can be applied to a number of different reports, including the four reports we specified above. Smart List filters can help you put together a simple segmentation for more fine-grain reporting. You can use these reports to answer specific questions about your email performance. For example,
- How did leads from the United States with a lead score greater than 50 perform?
- Did leads in the "New" lifecycle stage perform better than MQLs?
- How much does acquisition program matter for your engagement stream performance in your nurture programs?
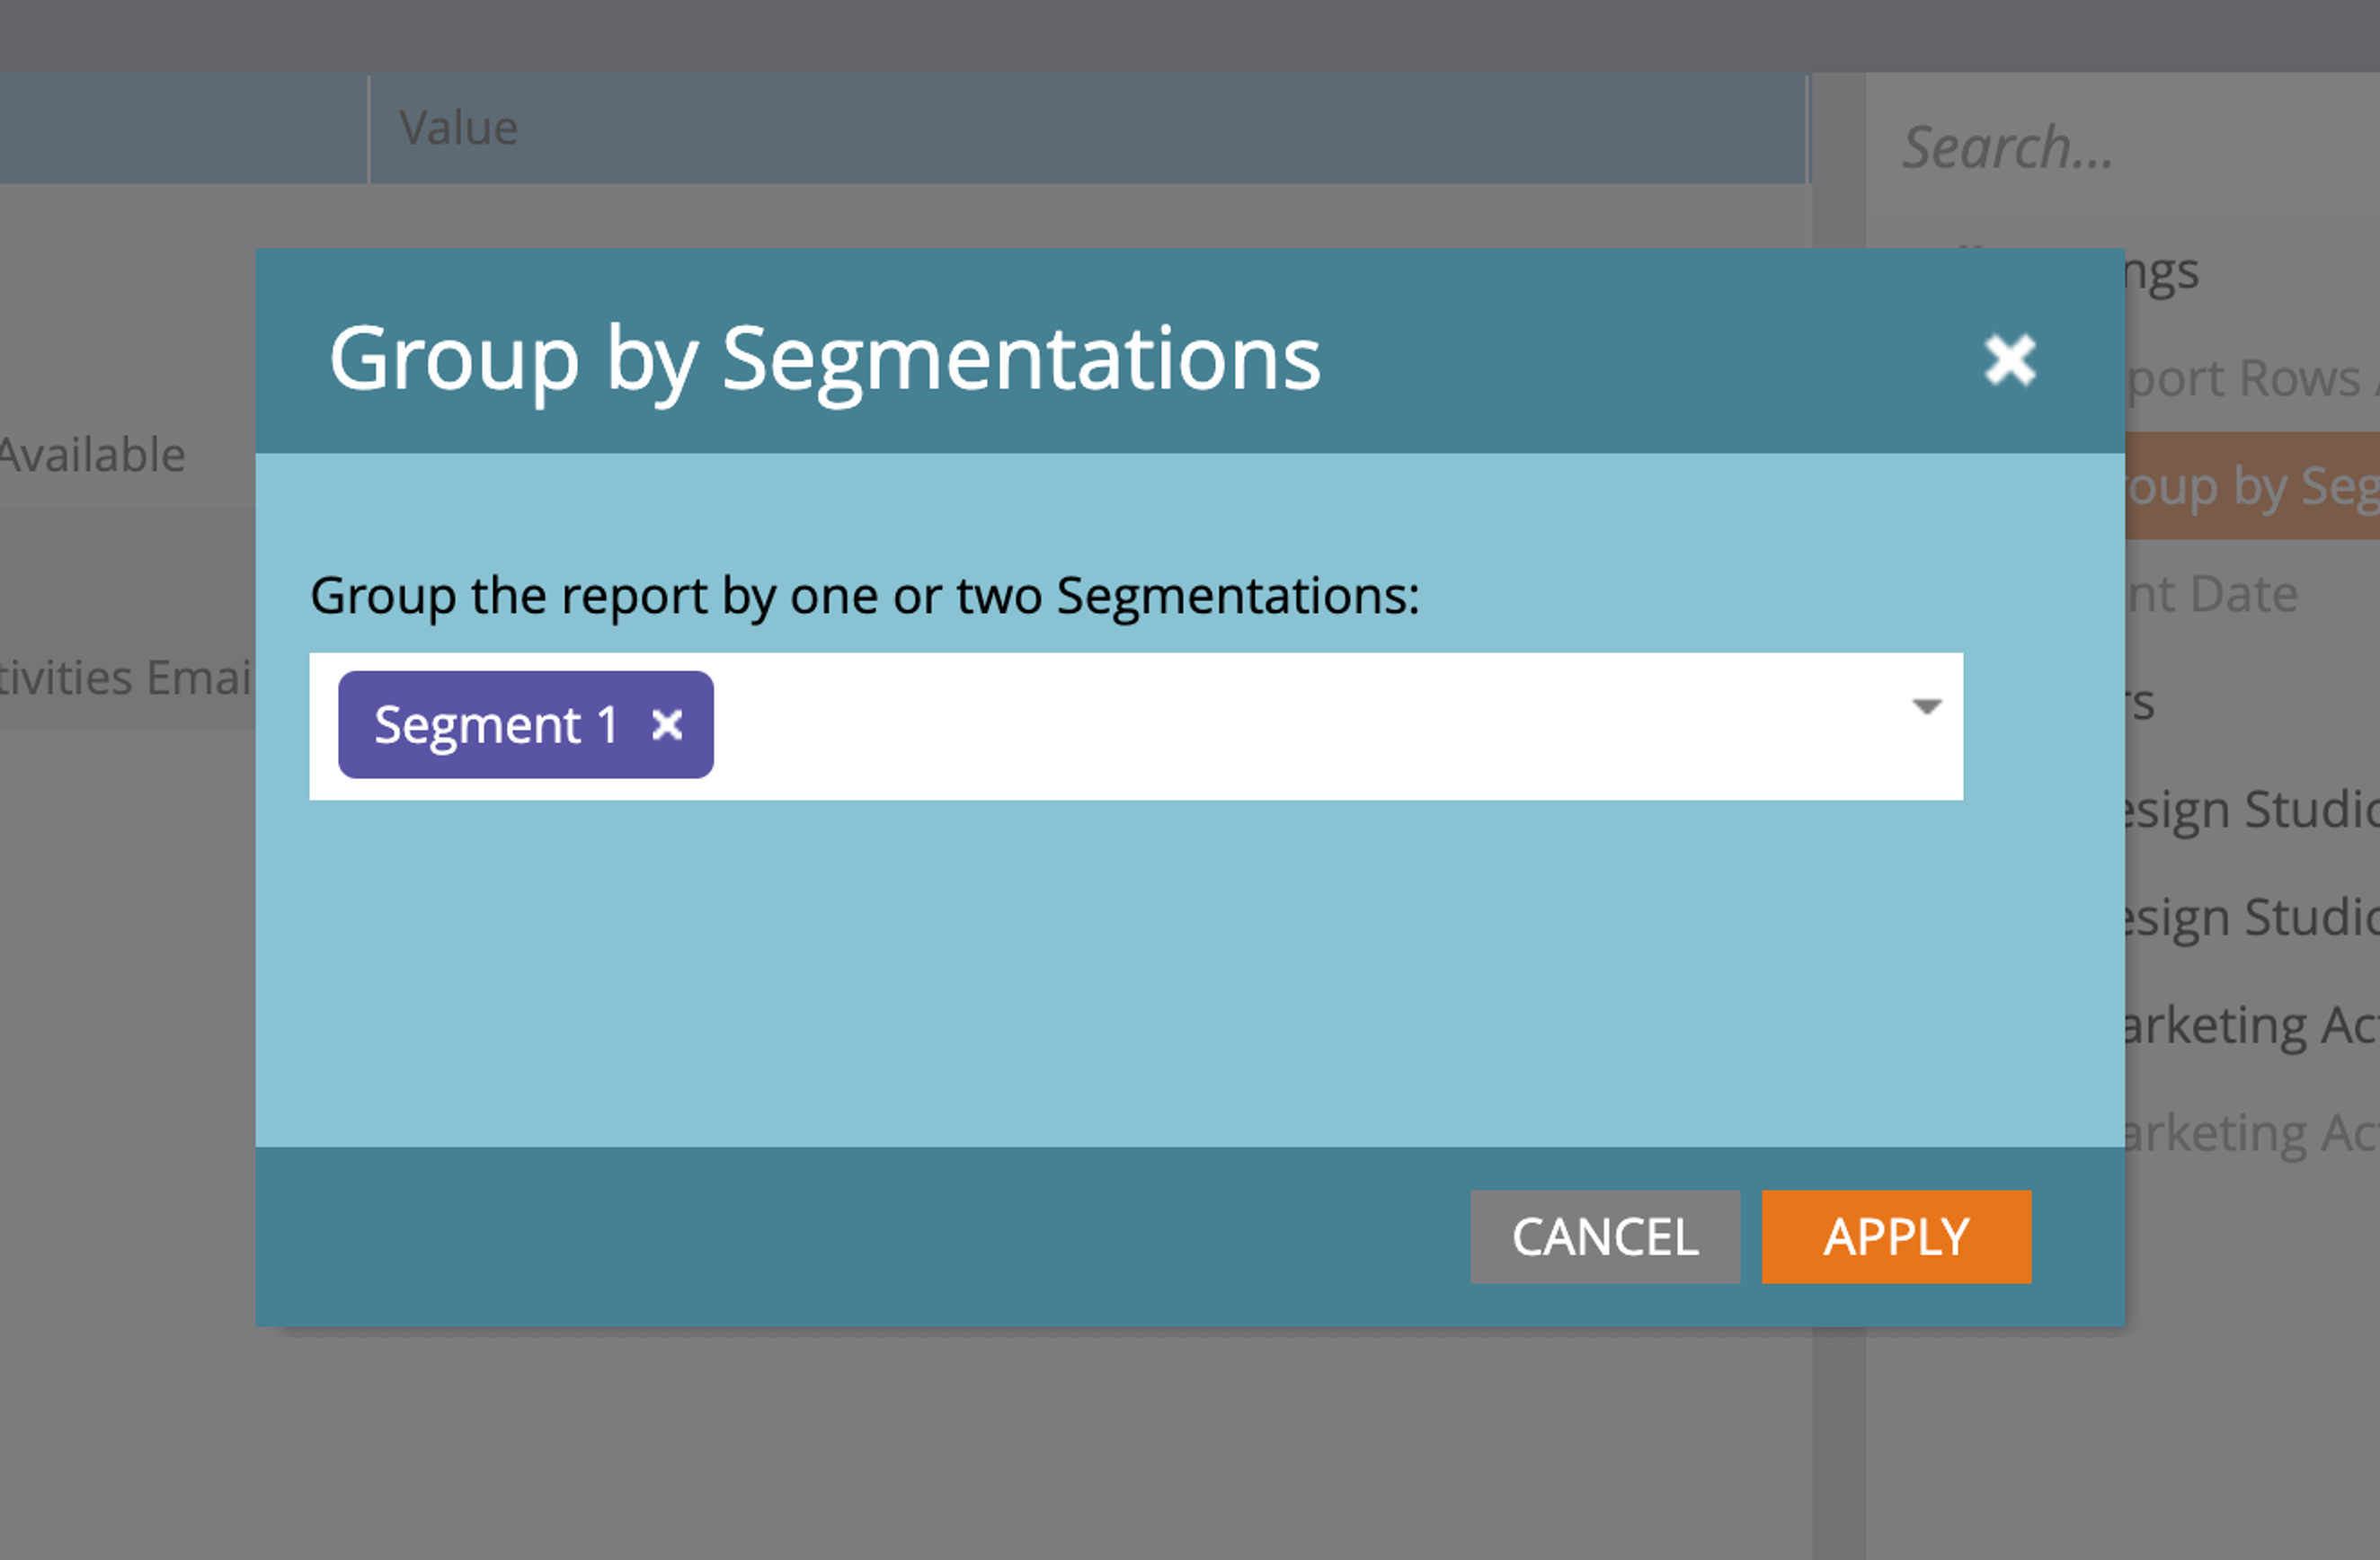
Setup and Configuration Options for Marketo Email Reports
Each type of Marketo Email Report will have its own options in the Setup tab for you to review. These settings can help you dig deeper into your email performance. For example, for the Email Performance Report you can Group by Segmentations to compare how different segments perform.
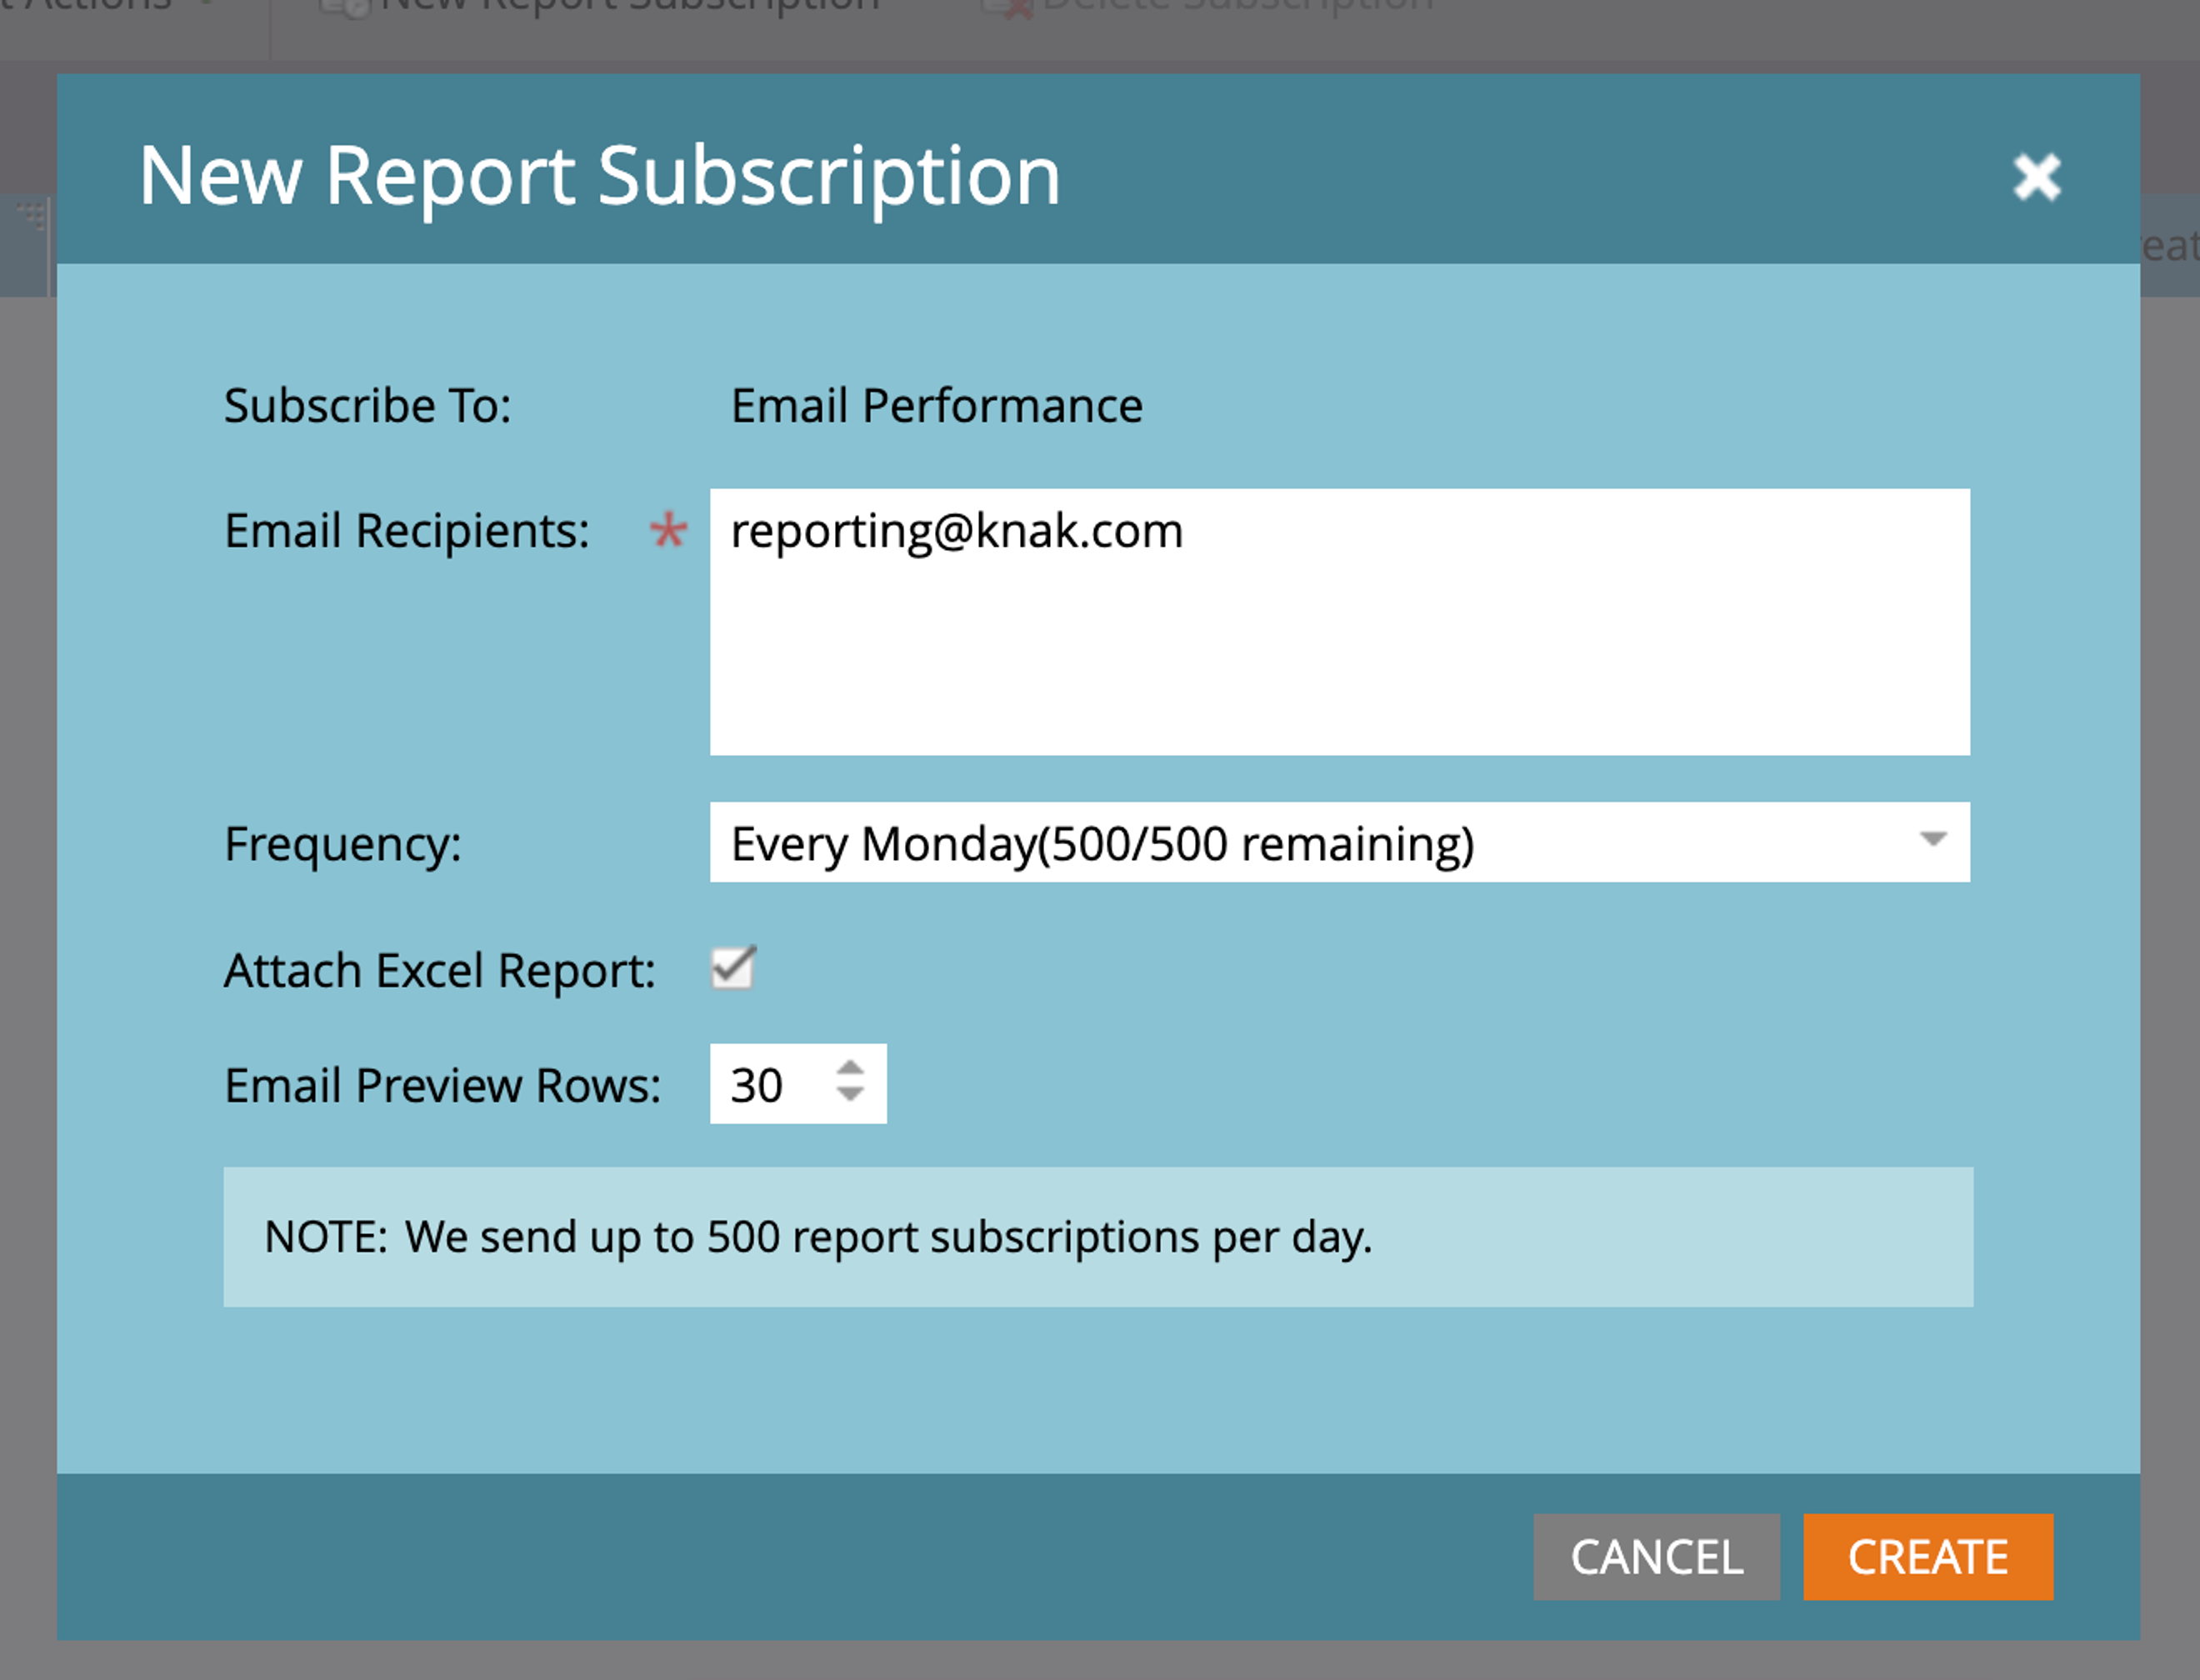
Automating Marketo email reports through subscriptions
You can use the Subscriptions feature to set up automated reports for anyone in your organization (they don't need to be a Marketo user). The automation will send an email at a frequency of your choosing and can optionally attach an Excel report. A word of caution: it's easy to accumulate email reports in your inbox, so use this feature sparingly.
How to optimize your emails with reporting and metrics
Reporting on your email performance is only step 1–the next step is to interpret those results and make adjustments. The ideal content process starts with creation but ends with optimization so you can make your next piece of content better. Continuous optimization is an iterative process and by making this step part of your process, you'll begin to accumulate significant improvements over time. For guidance, learn Marketo offers practical insights.
Let's look at some examples of various email metrics and how those data points can help us with an optimization strategy. We'll look at three metrics:
- Open Rate
- Click Rate
- Unsubscribe Rate
Open Rate
As an example, let's say your email campaign has an open rate of 8% – far below the industry benchmark of 15% (depending on the industry).
Optimization Strategies
- Subject line testing: Start experimenting with different subject lines to see what works and what doesn't. Marketo's A/ B testing functionality is perfect for this.
- Sender name: Test out different sender names and avoid using impersonal names like "noreply" or "marketing."
- Send time: Review what time you schedule emails and try different times of the day to see if you can improve open rates
Click Rate
What if your email has a high open rate, like 20%, but the click rate is only 2%? You're doing a good job of getting your audience's attention yet you're likely failing to transform that into action.
Optimization Strategies
- Content relevancy: Make sure the content of your email matches the expectations set by the subject line. If you're promising something, make sure you deliver on that promise.
- Clear call-to-action: Are your CTAs prominent and formatted in a way that grabs attention? CTA buttons are effective as well as actionable language.
- Link placement: Experiment with where you place links within the email, and place important links higher up in the email to see if that improves click rates.
Unsubscribe Rate
An email with a high unsubscribe rate, typically greater than 1%, is a cause for concern and could indicate a number of challenges.
Optimization Strategies
- Email frequency: Review how often you send marketing emails to your audience. Too many emails can lead to subscriber fatigue and cause contacts to unsubscribe.
- List health: Periodically review the health of your email lists. List hygiene activities like removing stagnant, unengaged contacts can help prevent unsubscribe rates from spiking.
- Preference Center: Instead of only offering unsubscribing as an option, you could use a preference center to give contacts the opportunity to manage communication preferences. You could reduce unsubscribe rates by offering the ability to reduce the number of emails sent per week.
Marketo content creation and the power of continuous optimization
The classic idiom, 'what you measure, you improve,' holds true for Marketo emails. Reporting on the success of your email campaigns and email performance is a necessary step in the content creation process. Feeding those reporting insights into your content development stage is critical – getting results requires continuous optimization.
One aspect we didn't touch on in great detail, but is relevant – your Marketo email templates. The templates you create in Marketo are the foundation of all emails sent by the system. Well-designed email templates can provide a significant performance boost. Iterating and optimizing those templates over time mimics the astounding power of compound interest. At first, the incremental results are nearly imperceptible, yet over time, the value accumulates to result in significant improvements.
Knak is a no-code campaign creation tool built for Marketo users. You can design, develop, and sync all your email templates to Marketo, while continuously iterating on the template. Knak's collaboration tools ensure everyone can access the emails and use a simple UI to make changes. Check out our no-obligation video demo here.
Frequently Asked Questions
CTR (Click-Through Rate) measures the percentage of delivered emails that received a click, while CTOR (Click-to-Open Rate) compares the number of clicks to the number of opens. CTOR gives insight into how effective your content is once the email is opened.
A good unsubscribe rate is typically below 0.5%. Anything above 1% may signal issues with email frequency, content relevance, or list quality and should prompt a review of your email strategy.
Marketo calculates click rate by dividing the number of unique clicks by the total number of delivered emails, then expressing that as a percentage. It shows how well your email content drives recipient engagement.
Key metrics include open rate, click rate, click-to-open rate, bounce rate, unsubscribe rate, and spam complaints. Each gives insight into different stages of recipient engagement and email performance.
To improve CTR, make sure your content delivers on the subject line’s promise, use clear and compelling call-to-action buttons, and test link placement within the email. Also, ensure mobile responsiveness and segment your audience for more targeted messaging.